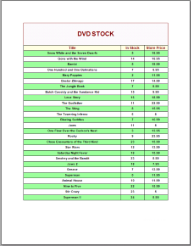
You can create a Green Bar report by alternating the background color of a data region like a Table using conditional formatting. The following steps demonstrate Follow the steps below to learn creating a Green Bar Report.
These steps assume that you have already added a Page Report template to your project, connected it to a data source and added a dataset. See Adding an ActiveReport to a Project, Connect to a Data Source and Add a Dataset for more information.
- From the Visual Studio toolbox, drag and drop a Table data region onto the design surface.
- In the Table data region, click the row handle to the left of the detail row and right-click to select Properties.
- In the Properties Window dialog that appears, set the following expression in the BackgroundColor property:
=iif(RowNumber(Nothing) Mod 2, "PaleGreen", "White") - On the design surface, set fields the detail row of the table data region.
- Go to Preview tab and view the result. You will notice that every alternate detail the report displays has a green background.
The following image shows an example of a Green Bar report:


